Financial performance at a glance
The department recorded a favourable net result of $4.7 million in 2023-24, compared with the unfavourable net result of $4.7 million estimated in the 2023-24 revised budget.
The favourable revenue variance is due to actual revenue exceeding the revised revenue budget by $1.9 million. This is mainly due to additional regulatory fees and charges revenue received by CBS and SafeWork SA.
The favourable expenditure variance is due to actual expenses being lower than the revised expenses budget by $7.6 million. The majority of this underspend relates to funding which the Department will seek to carry forward into 2024-25.
Statement of Comprehensive Income | 2023-24 Budget $000s | 2023-24 Actual $000s | Variation $000s | 2022-23 Actual $000s |
|---|---|---|---|---|
Total Income | 300,660 | 302,528 | 1,868 | 292,467 |
Total Expenses | 305,402 | 297,838 | 7,564 | 285,891 |
| Net Result | (4,742) | 4,690 | 9,432 | 6,576 |
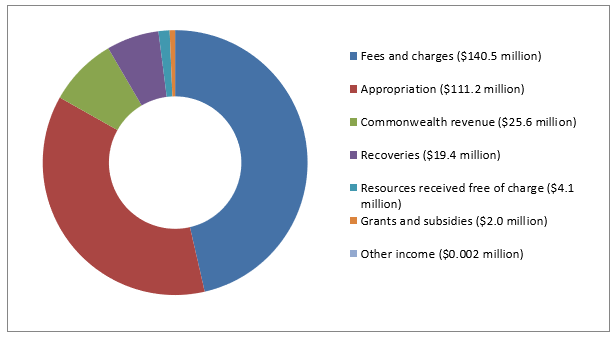
Total operating income for 2023-24, including appropriation, was $302.5 million.
Income from State Government appropriations accounted for 37% of total income. A summary of income by source is shown in the figure below.
Income by category 2023-24
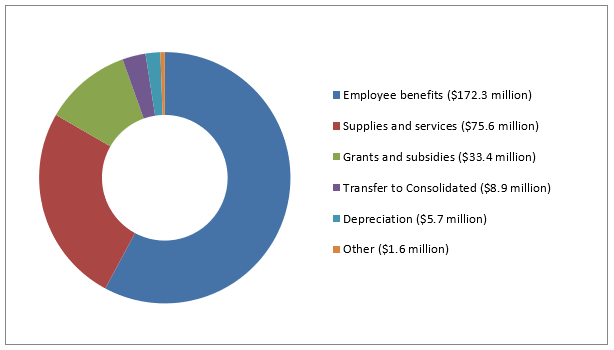
Total expenses were $297.8 million in 2023-24. A summary of expenses by category is shown in the figure below.
Expenses by category 2023-24
Statement of Financial Position
The following is a brief summary of the overall financial position of the agency.
Statement of Financial Position | 2023-24 Budget $000s | 2023-24 Actual $000s | Variation $000s | 2022-23 Actual $000s |
|---|---|---|---|---|
Current assets | 66,131 | 77,563 | 11,432 | 74,286 |
Non-current assets | 38,961 | 37,499 | (1,462) | 33,710 |
Total assets | 105,092 | 115,062 | 9,970 | 107,996 |
Current liabilities | 28,227 | 29,846 | (1,619) | 28,315 |
Non-current liabilities | 34,666 | 33,585 | 1,081 | 32,740 |
Total liabilities | 62,893 | 63,431 | (538) | 61,055 |
Net assets | 42,199 | 51,631 | 9,432 | 46,941 |
Account Payment Performance
Treasurer’s Instruction 11 requires all undisputed accounts to be paid within 30 days of the date of the receipt of the invoice or claim unless there is a discount or written agreement between the agency and the creditor.
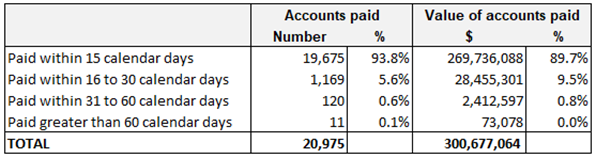
The department paid 99.3% of all invoices within 30 calendar days (99.1% in 2022‑23). The remaining 0.7% of invoices reflect both disputed amounts and late payment of undisputed accounts.
Consultants disclosure
The following is a summary of external consultants that have been engaged by the agency, the nature of work undertaken, and the actual payments made for the work undertaken during the financial year.
Consultancies | Purpose | $ Actual payment |
|---|---|---|
All consultancies below $10,000 each - combined | Various | $87,097 |
Consultancies | Purpose | $ Actual payment |
|---|---|---|
Engineering Materials Evaluation Pty Ltd T/A ATTAR | Professional engineering services and expert report | $11,390 |
MBP Engineering Pty Ltd | Professional engineering services and expert report | $12,000 |
Eliot's Automotive Services | Investigation, examination and expert report | $12,822 |
Vision Australia Ltd | Accessibility Audit | $14,110 |
Koukourou Pty Ltd T/A FMG Engineering | Professional engineering services and expert report | $14,725 |
Rosslyn Cox and Mark Williams Consulting Pty Ltd | Review of Industrial Relations in the SA Public Sector | $17,300 |
Bee Squared Consultants Pty Ltd | Workflow Review and Process Improvement | $19,500 |
Field Engineers Pty Ltd | Professional engineering services and expert report | $29,680 |
Nery Ergonomic Services Pty Ltd T/A HF Engineering | Professional engineering services and expert report | $49,000 |
Novasense Pty Ltd T/A Strativity | Development of a Customer Experience Strategy | $209,343 |
Total | $476,967 |
Data for previous years is available at: https://data.sa.gov.au/data/dataset/attorney-generals-department-annual-report-data-consultants
See also the Consolidated Financial Report of the Department of Treasury and Finance for total value of consultancy contracts across the South Australian Public Sector.
Contractors
Contractors | Business Unit | Value |
|---|---|---|
All contractors below $10,000 each | Various | $ 23,471 |
Contractors above $10,000 each | ||
Hoban Recruitment Pty Ltd | SACAT | $12,663 |
Paxus Australia Pty Ltd | ICT | $21,313 |
Randstad Pty Ltd | OMBUD | $22,660 |
Hays Specialist Recruitment (Australia) Pty Ltd | ICT | $24,254 |
Talent International (SA) Pty Ltd | CBS | $29,324 |
Hudson Global Resources (Aust) Pty Ltd | SACAT | $29,366 |
Hays Specialist Recruitment (Australia) Pty Ltd | SAET | $42,482 |
Randstad Pty Ltd | SRSA | $49,572 |
Smaart Pty Ltd | SACAT | $66,911 |
Talent International (SA) Pty Ltd | OPC | $68,420 |
HR Partners Pty Ltd | SACAT | $74,074 |
Hays Specialist Recruitment (Australia) Pty Ltd | FSSA | $79,079 |
Chandler Macleod Group | SACAT | $80,175 |
Halcyon Knights Pty Ltd | SACAT | $82,169 |
Randstad Pty Ltd | SACAT | $98,686 |
Randstad Pty Ltd | CBS | $132,466 |
Talent International (SA) Pty Ltd | ICT | $149,223 |
Hays Specialist Recruitment (Australia) Pty Ltd | CBS | $184,411 |
DFP Recruitment Services Pty Ltd | CBS | $186,355 |
Talent International (SA) Pty Ltd | JTS | $410,505 |
Akkodis Australia Talent Pty Ltd | JTS | $421,639 |
Hays Specialist Recruitment (Australia) Pty Ltd | SACAT | $576,811 |
Paxus Australia Pty Ltd | JTS | $1,194,261 |
Total | $ 4,060,289 | |
Data for previous years is available at: https://data.sa.gov.au/data/dataset/attorney-generals-department-annual-report-date-contractors
The details of South Australian Government-awarded contracts for goods, services, and works are displayed on the SA Tenders and Contracts website. View the agency list of contracts.
The website also provides details of across government contracts.